- Product
- PulseDeck
- Focus
- Developer Platform Engineering
- Audience
- Engineering-platform teams, DevOps teams and technical leaders improving delivery flow without reducing productivity to lines of code.
- Evidence
- Working demo, source and tests
What this system solves
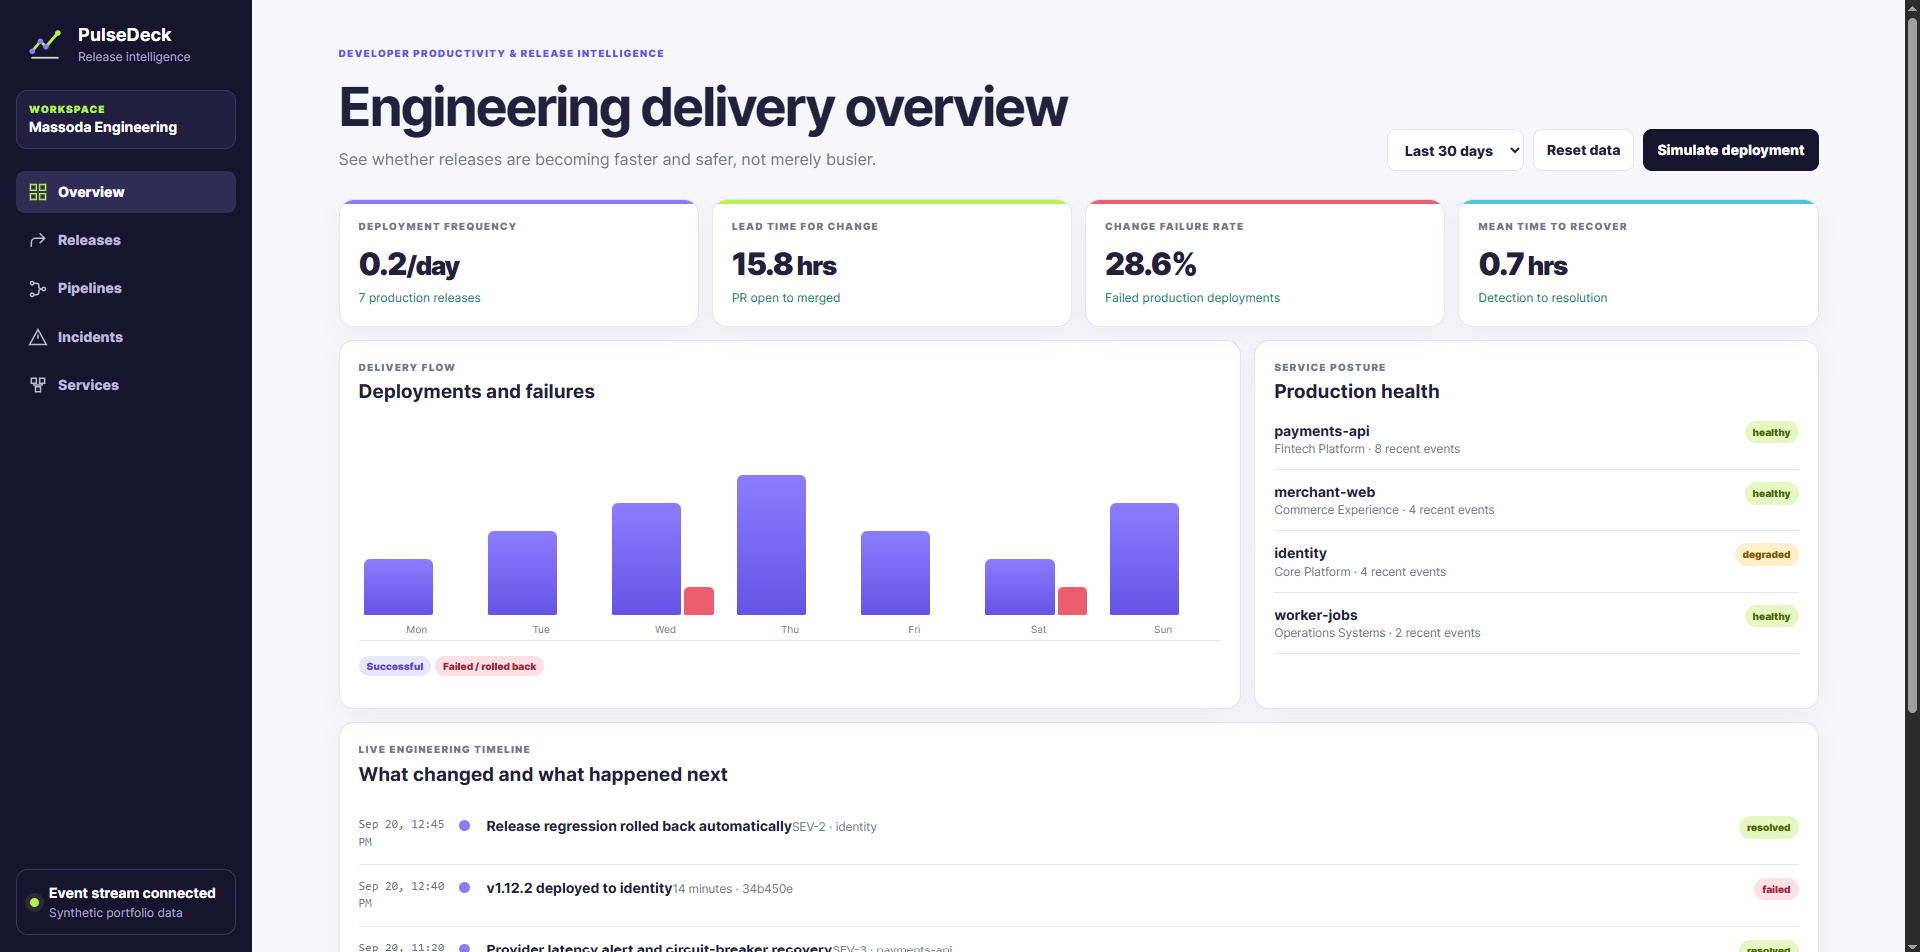
PulseDeck turns deployment, pull-request and incident events into a shared view of delivery speed, release safety, recovery and service ownership. Its indicators are calculated from an underlying synthetic event stream rather than displayed as decorative numbers.
Engineering-platform teams, DevOps teams and technical leaders improving delivery flow without reducing productivity to lines of code.
My role
I designed the event shapes, metric calculations, release-readiness model, incident narrative, service catalogue, interactive simulation and test suite.
Capabilities demonstrated
- Calculated deployment frequency and change-failure rate
- Calculated mean time to recover and pull-request lead time
- Reporting-window selection
- Release register and readiness contract
- CI/CD pipeline and flaky-test visibility
- Incident timeline, service ownership and deployment simulation
System flow
Important decisions
Metrics derive from events instead of decorative constants. Service ownership is first-class, readiness is weighted rather than falsely binary, and recovery evidence is separated from post-incident follow-up.
Beyond the happy path
A simulated failed deployment creates a rollback incident and changes the calculated indicators. Local persistence preserves user-generated demonstration events until reset.
Testing and evidence
Automated tests cover delivery metrics, readiness scoring and service aggregation. All events and reported values are synthetic demonstration data.
Current limitations
The browser version does not connect to real source-control, CI/CD, cloud, monitoring or incident-management accounts.
Production extension path
A production version would verify webhook signatures, deduplicate delivery IDs, normalize provider events, store raw evidence and expose team-level metrics through authenticated APIs.
Tools and concepts
Let’s work together
Building something that needs to work beyond the happy path?
I help teams turn complex product, integration and reliability requirements into clear, maintainable software.